Santa Monica Income Property Market Report
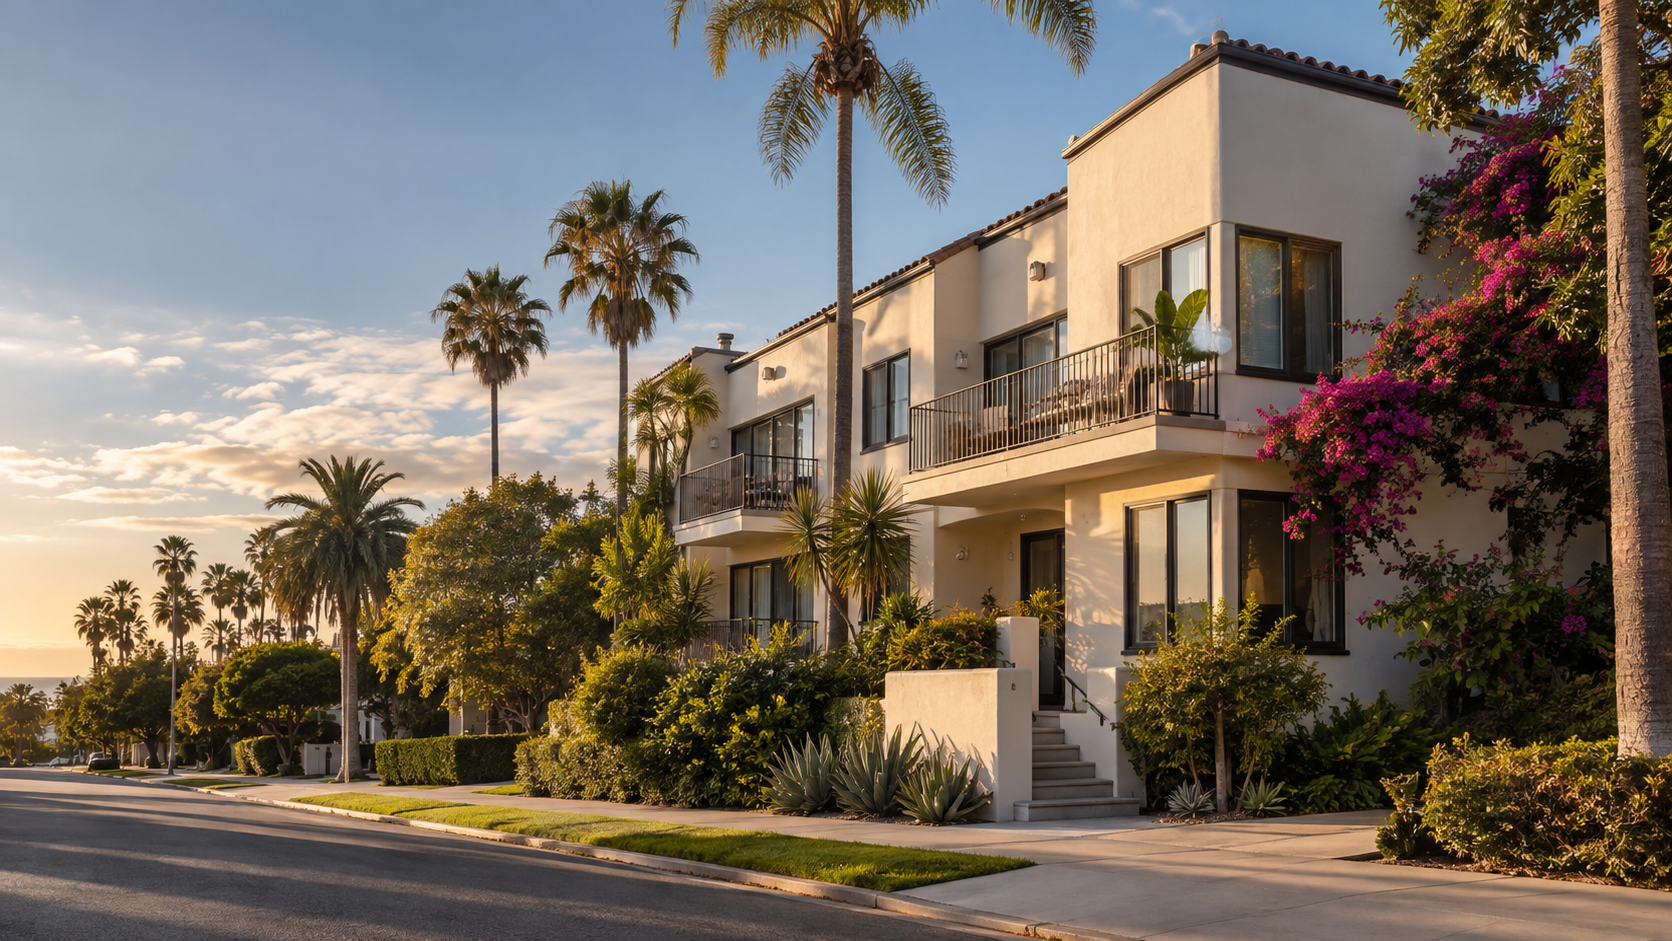
Santa Monica continues to be one of the most valuable and complex income-property markets in Los Angeles. From duplexes, triplexes and fourplexes to larger apartment buildings, multifamily properties in Santa Monica attract investors seeking long-term appreciation, rental income and ownership in a supply-constrained coastal city.
During the 12-month period from September 2025 through August 2026, 95 Santa Monica income properties closed through the Combined Los Angeles Westside MLS. Those transactions generated more than $303 million in total sales volume.
The citywide figures below cover those 95 closings. A separate detailed file contains 50 sales records, including 33 standard MLS-marketed sales and 17 transactions entered as comparable or “COMP” sales. Results from the smaller groups are labeled throughout.
The median sale price was $2.25 million, while the average sale price was approximately $3.19 million. The considerable difference between the median and average reflects the diversity of Santa Monica’s multifamily market. A small duplex and a large apartment building may both be classified as income property, but they are fundamentally different investments.
This Santa Monica income-property market report examines prices, unit counts, days on market, sale-to-list ratios, cap rates and the factors buyers and sellers should consider when evaluating multifamily real estate.
Santa Monica Income Property Market at a Glance
From September 2025 through August 2026:
95 income properties sold
Total sales volume reached $303,236,566
The average sale price was $3,191,964
The median sale price was $2,250,000
Properties took an average of 53 days to sell
The average sale price was 96.52% of the average list price
The average sold price per square foot was $639.69
These citywide MLS figures cover 95 closings and show substantial variation in price, size, income and investment potential.
What Is the Median Price of an Income Property in Santa Monica?
The median sale price for a Santa Monica income property during the reporting period was $2.25 million.
The average sale price was significantly higher at approximately $3.19 million because several large transactions elevated the citywide average. The two highest reported sales were:
1318 2nd Street, which sold for $33.1 million
901 Ocean Avenue, which sold for approximately $25.83 million
Together, these two transactions represented approximately 19.4% of the city’s total reported income-property sales volume.
For buyers and sellers, this demonstrates why the average sale price alone can be misleading. A more accurate valuation requires comparing properties with similar locations, numbers of units, rental income, building sizes, lot sizes, conditions and tenant profiles.
How Did Duplexes and Small Income Properties Perform?
In the detailed sales data, properties with up to two reported units had the highest median sale price among the smaller multifamily categories.
Among standard MLS-marketed sales in this category:
The median sale price was approximately $2.3 million
The average sale price was approximately $2.31 million
The median time on market was 42 days
The weighted sale-to-list ratio was approximately 94.4%
Santa Monica duplexes can command significant prices because their value is not based exclusively on rental income. Buyers may also consider owner occupancy, development potential, land value, location, outdoor space and the possibility of creating or expanding an accessory dwelling unit.
A duplex in 90402 near the beach or north of Montana Avenue will not necessarily trade at the same income multiple as a duplex in 90404 or 90405. The condition of the units, tenant status and applicable rent-control restrictions can also materially affect value.
How Did Santa Monica Triplexes and Fourplexes Perform?
Three-unit and four-unit properties formed the largest segment of the detailed standard MLS sales data.
For triplexes and fourplexes:
The median sale price was approximately $1.75 million
The average sale price was approximately $1.87 million
The median price per unit was approximately $533,000
The median time on market was 31 days
The weighted sale-to-list ratio was approximately 96.2%
Triplexes and fourplexes often appeal to both investors and owner-users. A buyer may occupy one unit and collect rent from the remaining units, subject to the existing tenancies, lease terms and applicable laws.
Fourplexes also occupy an important financing category because properties with one to four residential units may qualify for residential financing, while properties with five or more units are generally evaluated as commercial multifamily investments.
However, unit count alone does not establish value. Investors must examine actual rents, market rents, expenses, vacancy, deferred maintenance, unit configuration and the legal status of every unit.
How Did Five-Unit and Larger Apartment Buildings Perform?
Among the standard MLS-marketed properties with five or more reported units:
The median sale price was approximately $2.22 million
The average sale price was approximately $2.2 million
The median price per unit was approximately $444,000
The median time on market was 37 days
The weighted sale-to-list ratio was approximately 94.9%
The average marketing period exceeded 100 days, but this figure was affected by two properties that remained on the market for 157 and 408 days. This is why median days on market can provide a more representative picture than the average.
The value of a Santa Monica apartment building depends heavily on its net operating income, existing rents, operating expenses, tenant history, rent-control status and potential for future income growth.
Larger apartment buildings should not be valued solely by price per square foot. Cap rate, gross rent multiplier, price per unit and verified net operating income are essential components of a credible multifamily valuation.
Are Santa Monica Income Properties Selling Below Asking Price?
In the detailed sample of 33 standard MLS-marketed sales:
27 properties sold below the final list price
2 properties sold at the final list price
4 properties sold above the final list price
The weighted sale-to-list ratio was approximately 95.45%.
This means that most properties in the sample required some negotiation below the final asking price. It does not necessarily mean that Santa Monica income-property values were declining. Some properties may have entered the market at aspirational prices, undergone price reductions or required adjustments for condition, tenants, income or deferred maintenance.
The available figures compare the sale price with the final list price. They do not measure the difference between the original asking price and the eventual sale price.
For sellers, accurate initial pricing remains critical. Buyers of income property generally analyze the numbers carefully. If the rents, cap rate, expenses and development potential do not support the price, the property may remain on the market even in a desirable location.
How Long Does It Take to Sell a Santa Monica Multifamily Property?
The citywide MLS report of 95 closings showed an average of 53 days to sell.
Among the 33 standard MLS-marketed transactions in the detailed data:
14 sold within 30 days
8 sold in 31 to 60 days
2 sold in 61 to 90 days
3 sold in 91 to 120 days
6 required more than 120 days
The median was 36 days, while the average was approximately 69 days.
The difference between these figures shows that a relatively small group of slow-moving listings increased the average. Approximately 42% of the standard MLS sales closed within their first 30 days on the market.
Seventeen additional transactions were entered as comparable or “COMP” sales with zero reported days on market. These records may include off-market or administratively entered transactions. They should not be combined with openly marketed listings when determining how long it normally takes to sell a Santa Monica income property.
What Cap Rates Are Santa Monica Income Properties Producing?
Only 14 of the 50 detailed sales records included a reported cap rate; this is not a citywide cap-rate sample.
Among those properties:
Reported cap rates ranged from 3.81% to 6.96%
The median reported cap rate was approximately 4.86%
The average reported cap rate was approximately 5.19%
Because cap-rate information was available for only a portion of the sales, these figures should be treated as general reference points rather than definitive market-wide benchmarks.
A cap rate is calculated by dividing a property’s net operating income by its value or purchase price. The reliability of the result depends entirely on the accuracy of the income and expense information.
Before relying on a reported cap rate, verify the rent roll, leases, collections, operating expenses, property taxes, insurance and whether the stated income is actual or projected. Check each unit’s rent-control status as part of that review.
A property advertised with a higher cap rate is not automatically a better investment. The higher return may reflect physical problems, tenant issues, deferred maintenance, location differences or greater regulatory and operational risk.
What Is GRM, and How Is It Used?
The gross rent multiplier, or GRM, compares a property’s price with its gross annual rental income.
GRM can be useful for making a preliminary comparison between similar Santa Monica apartment buildings, but it does not account for operating expenses. Two buildings with the same gross income can produce very different net operating incomes if one requires substantially more maintenance, insurance or owner-paid utilities.
Investors should use GRM together with cap rate, price per unit, price per square foot and a detailed expense analysis.
No single measurement should be used by itself to determine the value of a multifamily property.
How Does Santa Monica Rent Control Affect Income-Property Value?
Santa Monica rent control can significantly affect the value and future income potential of a duplex, triplex, fourplex or apartment building.
A proper analysis should examine:
Whether each unit is subject to Santa Monica rent control
Current rents and lawful rent levels
Tenant move-in dates
Security deposits
Registration records
Existing leases
Allowable annual increases
Vacancy history
Owner-occupancy considerations
Ellis Act history
Relocation obligations
Code violations or unpermitted units
Tenant buyout agreements
Potential ADU or JADU opportunities
Properties with long-term tenants paying below-market rents may trade differently from properties with vacant units or rents closer to current market levels.
However, below-market rents do not automatically make a property undesirable. Some investors prioritize long-term appreciation, stable occupancy, land value or future estate-planning benefits over immediate cash flow.
Every building requires its own legal, financial and physical review.
Which Santa Monica ZIP Codes Should Investors Consider?
Santa Monica’s principal residential ZIP codes include 90401, 90402, 90403, 90404 and 90405.
Each ZIP code contains different property characteristics:
90401 includes Downtown Santa Monica and areas near the beach
90402 includes North of Montana and some of Santa Monica’s highest land values
90403 includes areas around Wilshire Boulevard and Montana Avenue
90404 includes central Santa Monica and portions of the Pico neighborhood
90405 includes Ocean Park, Sunset Park and the southern portion of Santa Monica
For a search of two units or more, I’d start with 90404 and 90405. Add 90401 if you want a downtown location, then consider 90403 and 90402 when a specific property’s income justifies its price.
ZIP codeWhy consider it90404A practical first stop for duplexes and apartment buildings in central Santa Monica.90405Ocean Park and Sunset Park offer smaller income properties and coastal appeal.90401Downtown access can attract renters; underwrite the purchase price carefully.90403Consider smaller properties where existing income supports the premium.90402Evaluate individual opportunities rather than treating it as a routine multifamily search.
The right question is: Does this building work at its legal income? Before judging a deal by its ZIP code or advertised cap rate, confirm the legal unit count, each unit’s rent-control status, actual rents, zoning, and likely repair costs. Santa Monica provides an address and parcel search for rent-control records; zoning and development potential also need to be checked for the individual parcel.
My starting point: Search 90404 and 90405 first, then follow the numbers wherever a well-documented property appears.
Is Now a Good Time to Sell a Santa Monica Income Property?
The answer depends on the property.
The market produced 95 closed sales and more than $303 million in volume during the reporting period, demonstrating continued demand for Santa Monica multifamily real estate.
However, buyers remain analytical and price-sensitive. In the 33 standard MLS-marketed sales in the detailed file, 27 sold below the final asking price.
Owners considering a sale should begin with a property-specific evaluation that examines:
The number and legal status of units
Existing rental income
Current expenses
Rent-control status
Tenant occupancy
Deferred maintenance
Location and ZIP code
Lot size and zoning
ADU potential
Price per unit
Price per square foot
Cap rate and GRM
Comparable multifamily sales
A thoughtful pricing and marketing strategy can help position a Santa Monica income property for the widest possible pool of investors, owner-users and exchange buyers.
Frequently Asked Questions About Santa Monica Income Property
Are duplexes and fourplexes considered multifamily properties?
Yes. Duplexes, triplexes and fourplexes are commonly described as small multifamily or residential income properties. Properties with five or more units are generally treated as commercial multifamily properties for financing and valuation purposes.
What is the difference between cap rate and GRM?
Cap rate measures net operating income relative to property value. GRM compares the purchase price with gross rental income before expenses. Both depend on accurate financial information.
Thinking About Selling or Buying a Santa Monica Income Property?
Every Santa Monica duplex, triplex, fourplex and apartment building has a different financial and regulatory profile. Citywide averages provide context, but a reliable valuation must account for the property’s location, rents, expenses, tenants, condition, zoning and future potential.
For a confidential Santa Monica income-property valuation or a detailed multifamily investment analysis, contact us.
Source: Combined Los Angeles Westside Multiple Listing Service. Reporting period: September 2025 through August 2026. Report generated September 17, 2026. Information is deemed reliable but not guaranteed and may not reflect all real estate activity. This analysis reflects MLS-reported sales. Income properties may also sell off market or through LoopNet or CoStar without appearing in the MLS, so it may not capture every sale. Properties may or may not have been listed or sold by the broker or agent presenting this information.