90016 Multifamily Sales Breakdown
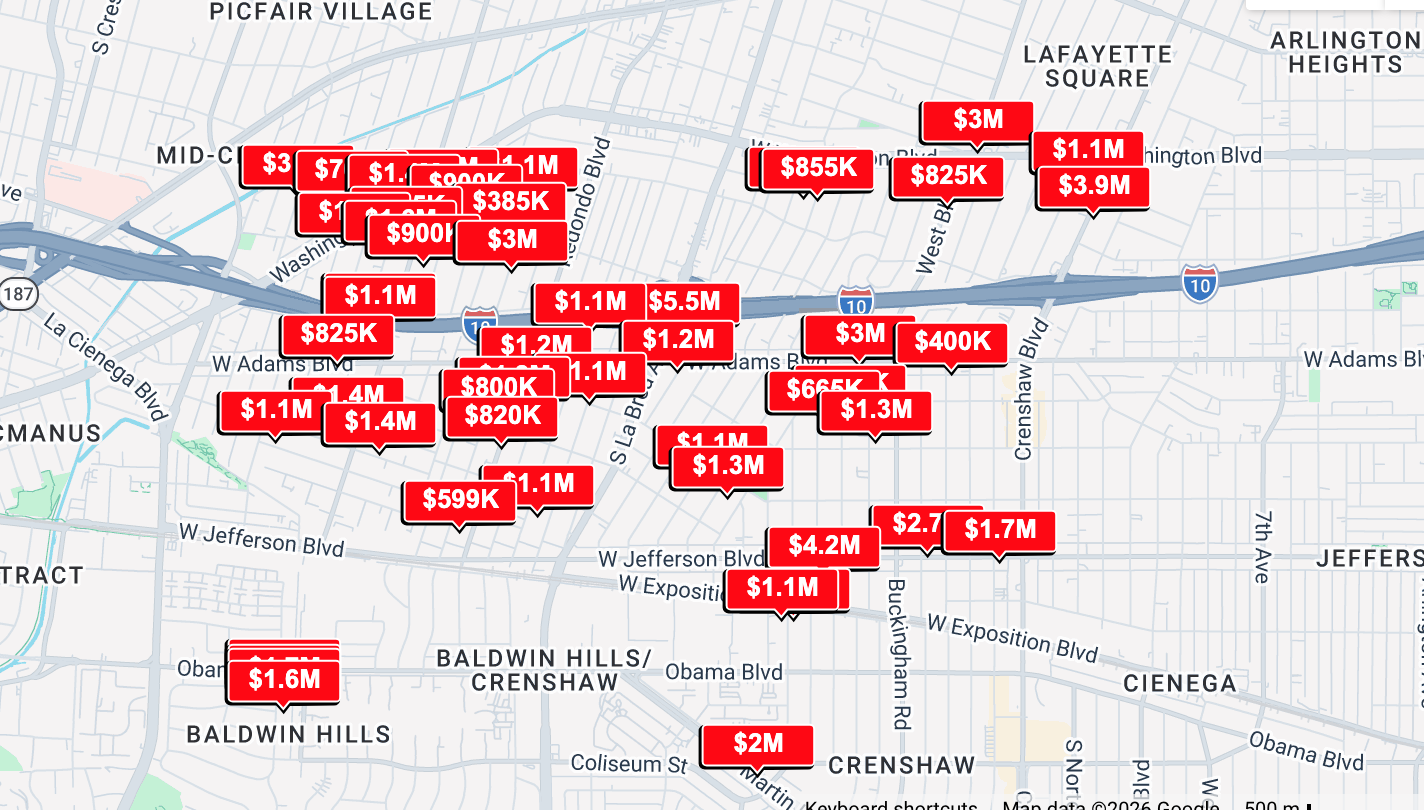
Based on closed sales, April 2025 to April 2026.
90016 Duplex Sales (2 Units - Pricing Breakdown)
2734 S Redondo Blvd – Sold $820,000 | 1,286 SF | 4,804 Lot
2134 S Curson Ave – Sold $700,000 | 1,650 SF | 5,431 Lot
2022 West Blvd – Sold $825,000 | 1,607 SF | 6,601 Lot
2010 S Rimpau Blvd – Sold $855,000 | 2,476 SF | 6,560 Lot
2229 S Cochran Ave – Sold $1,050,000 | 1,737 SF | 5,016 Lot
2708 S Orange Dr – Sold $1,125,000 | 2,228 SF | 4,810 Lot
2123 S Ridgeley Dr – Sold $1,085,000 | 2,211 SF | 9,414 Lot
Sold Duplex Data 90016:
Price Range: $700,000 → $1,125,000
Lot Size Range: ~4,800 → 9,400 SF
Wide pricing spread due to:
Owner-user vs investor demand
Development potential
Condition + vacancy
Example: Ridgeley sold for development, not income
90016 Triplex Sold Comps (3 Units)
2213 S Burnside Ave – Sold $900,000
2235 Hauser Blvd – Sold $965,000
3527 Chesapeake Ave – Sold $1,100,000
2919 S Palm Grove Ave – Sold $1,050,000
2701 Alsace Ave – Sold $1,200,000
Triplex Facts:
Price Range: $900,000 → $1,200,000
Strong overlap with duplex pricing
Buyers still partially owner-user driven
90016 Fourplex Sold Comps (4 Units – Cap Rate + GRM)
5630 Blackwelder St – Sold $1,105,000 | GRM 16.60
2125 Crenshaw Blvd – Sold $1,065,000 | GRM 12.87
2531 Hauser Blvd – Sold $1,065,000 | Cap Rate 7.28% | GRM 10.11
2120 Carmona Ave – Sold $1,350,000
2309 Hauser Blvd – Sold $1,595,000 | Cap Rate 6.10% | GRM 11.90
2672 Redondo Blvd – Sold $1,775,000 | Cap Rate 7.14% | GRM 9.54
2404 Cochran Ave – Sold $3,006,075 | Cap Rate 5.94% | GRM 13.16
2202 Thurman Ave – Sold $3,500,000 | Cap Rate 5.74% | GRM 13.62
Fourplex Facts:
Price Range: $1.06M → $3.5M
Cap Rate Range: ~5.7% → 7.3%
GRM Range: ~9.5 → 16.6
This is where it transitions into true investor underwriting
90016 5 Unit Sold Data
2933 S Redondo Blvd – Sold $599,000
2530 S Sycamore Ave – Sold $1,125,000
2525 Hauser Blvd – Sold $3,342,000
5 Unit Facts:
Extremely wide range
Driven heavily by:
New construction vs older assets
Land value
Unit configuration
90016 6 Unit Sold Comps (Cap Rate + GRM)
5232 Westhaven St – Sold $800,000 | Cap Rate 3.39% | GRM 14.01
3442 Potomac Ave – Sold $4,150,000 | Cap Rate 5.84% | GRM 13.19
6 Unit Facts:
Cap Rate Range: ~3.4% → 5.8%
GRM Range: ~13 → 14
Huge difference between:
Value-add older assets
Brand-new construction
90016 7 Unit Sold Data
5511 Smiley Dr – Sold $1,370,000 | Cap Rate 4.90% | GRM 12.11
2305 S Marvin Ave – Sold $1,800,000 | Cap Rate 6.77% | GRM 9.95
2234 Crenshaw Blvd – Sold $3,940,000 | Cap Rate ~6.00%
7 Unit Facts:
Cap Rate Range: ~4.9% → 6.7%
GRM Range: ~9.9 → 12.1
90016 8 Unit Sold Data
3638 Carmona Ave – Sold $1,733,550 | Cap Rate 5.09% | GRM 12.03
3644 Carmona Ave – Sold $1,733,550 | Cap Rate 5.73% | GRM 11.17
3650 Carmona Ave – Sold $1,733,550 | Cap Rate 5.18% | GRM 11.90
3712 Carmona Ave – Sold $1,631,000 | Cap Rate 6.02% | GRM 10.80
8 Unit Facts:
Cap Rate Range: ~5.0% → 6.0%
GRM Range: ~11.0 → 12.0
90016 9 Unit Sold Data
5430 Smiley Dr – Sold $1,375,000
GRM 12.15 | cap range 5.25% to 6.0% |
90016 Larger Multifamily (10+ Units)Sold Data
2615 West Blvd – 10 Units – Sold $2,960,000
4500 MLK Jr Blvd – 12 Units – Sold $1,975,000
3406 Virginia Rd – 16 Units – Sold $2,650,000 | GRM 9.48
1909 Buckingham Rd – 16 Units – Sold $2,950,000
2535 Longwood Ave – 20 Units – Sold $5,490,000
3524 Chesapeake Ave – 27 Units – Sold $8,800,000 |
Cap Rate 5.33% 5.69% | GRM 11.63
36-unit → 8.03% cap (older/value-add)
What This Data Actually Shows About 90016 Multifamily Property Values
Across all property types in 90016, from duplexes to larger apartment buildings, pricing is not linear, and it is not driven by averages. Even within the same unit count, values vary significantly based on the specific characteristics of each property.
Duplexes and triplexes show a wide pricing range driven by a mix of owner-user demand, development potential, and condition. As properties move into the fourplex range, the market begins transitioning into true investor underwriting, where cap rate and income become more relevant.
From 5 units and above, the data becomes even more nuanced. New construction, value-add opportunities, zoning, and future development potential create significant pricing differences—even between properties with similar unit counts. Cap rates generally compress for newer or stabilized assets and expand for properties with upside.
By the time you reach 7 to 9 units and larger, the market begins to stabilize, with buyers focusing heavily on income, GRM, and long-term return. Larger properties show more consistent underwriting, but still vary depending on location, condition, and future potential.
The key takeaway is simple: No two multifamily properties are valued the same, even within the same category.
Value is driven by:
Income and upside potential
Lot size and zoning
Unit mix and layout
Parking, garages, and meters
Condition, upgrades, and building systems
Soft-story compliance and capital improvements
Location within 90016 and surrounding growth areas
Whether the property is in opportunity zone or not
These are the factors buyers analyze—and these are the factors that determine price.
Thinking About Selling a Multifamily Property in 90016
Selling a multifamily property in 90016 is not just about putting it on the market—it’s about how it’s positioned, priced, and negotiated.
What Multifamily Sellers Get Wrong in 90016
Most owners run into the same issues:
Pricing based on nearby sales instead of how buyers underwrite income
Marketing to the wrong buyer (missing investors or developers)
Overlooking upside like rent increases, ADUs, or zoning potential
Poor tenant coordination limiting access and showings
Deals falling apart when numbers don’t hold up in escrow
This is where value is lost.
Where We Bring Value
We approach your property as both an income-producing asset and a long-term investment opportunity, and position it accordingly:
Target the right buyers
Owner-users, investors, and developers-each values your property differently. I position it to attract all three and create competition.Price strategically
Based on cap rate, GRM, rent potential, and competing inventory, not just comparable sales.Identify and communicate hidden value
Including rental upside, ADU potential, unit mix improvements, and zoning capacity.Understand Opportunity Zone impact (where applicable)
Parts of 90016 fall within federally designated Opportunity Zones. When a property qualifies, it can attract tax-driven investors looking to defer or reduce capital gains—expanding the buyer pool and increasing demand.Position land vs income correctly
Some buyers underwrite current income, others focus on redevelopment potential. I make sure your property is marketed to both perspectives.Create leverage, not just exposure
The goal is not just to get offers—it’s to generate competing offers.Protect the deal in escrow
I align pricing and expectations upfront so the numbers hold up under real underwriting, reducing the risk of renegotiation.
What Determines Your Multi-units Value in 90016
Your property is not judged by averages. Buyers look at:
Income vs potential income
Cap rate and GRM
Lot size and zoning
Unit mix and layout
Parking, meters, and condition
Location within 90016
These factors—not just comps—determine your final price.
Before You Sell Your Income Units in 90016
Before making a decision, you should understand:
What your property is really worth today
Which buyer will pay the most
How to position it to maximize your outcome
I offer a confidential, data-driven evaluation so you can make the right decision before going to market.
Curious About What Your 90016 (West Adams / Mid-City) Multifamily Property Is Worth?
Whether you own a duplex, triplex, fourplex, or a 5+ unit building in 90016, accurate pricing depends on more than recent sales. Buyers evaluate cap rate, GRM, rental upside, zoning, and long-term investment potential—not just comparable properties.
Each property in West Adams and the surrounding Mid-City area behaves differently depending on the buyer—owner-user, investor, or developer. That’s why automated estimates and surface-level comps often lead to overpricing, missed opportunities, or price reductions.
Instant estimates may vary. For the most accurate 90016 multifamily valuation, contact me to analyze cap rates, GRM, rent trends, zoning, unit mix, condition, and buyer demand across West Adams and Mid-City Los Angeles.
Call or Text: 310-422-9001